Many moons ago, monitoring was as simple as spinning up a Nagios instance, or Solarwinds if the business you worked for was a little ‘flush’ with cash. It did exactly what you wanted, allowed you to monitor via SNMP or WMI, and it gave you a simple graphical interface for each ‘node’ that you looked after. Over the last few years though, there is far more to monitoring. Its an area I have an interest in, so I thought I’d document some of what I’ve seen recently.
So most posts I put on this blog can end up going on about how this technology X, Y or Z is great, and this other technology is dead, bla bla bla. This isn’t one of those posts. Monitoring nowadays requires a layered approach, there is no silver bullet, no product that does everything. Unless of course all you do is host a web app or what not.
You can define the different monitoring products in a few different categories. Some products will span more than one of these, but if something does ‘everything’ – point me in that direction. I’d love to see it!
- SIEM (Security information and event management)
- User experience monitoring (synthetic end-user monitoring)
- Infrastructure monitoring
- APM (Application performance monitoring)
Depending on your use case, you may need one, two, three or all four of these in order to build up full coverage over potential incidents or events that could occur in your infrastructure. And to add to that, you may not be monitoring to alert your infrastructure team, it could be your devs or your infosec team too, anyone who needs to operationally respond to a potential issue in your environment. Lets take a look at each different types of monitoring, why you need them and who are the products worth looking at.
SIEM
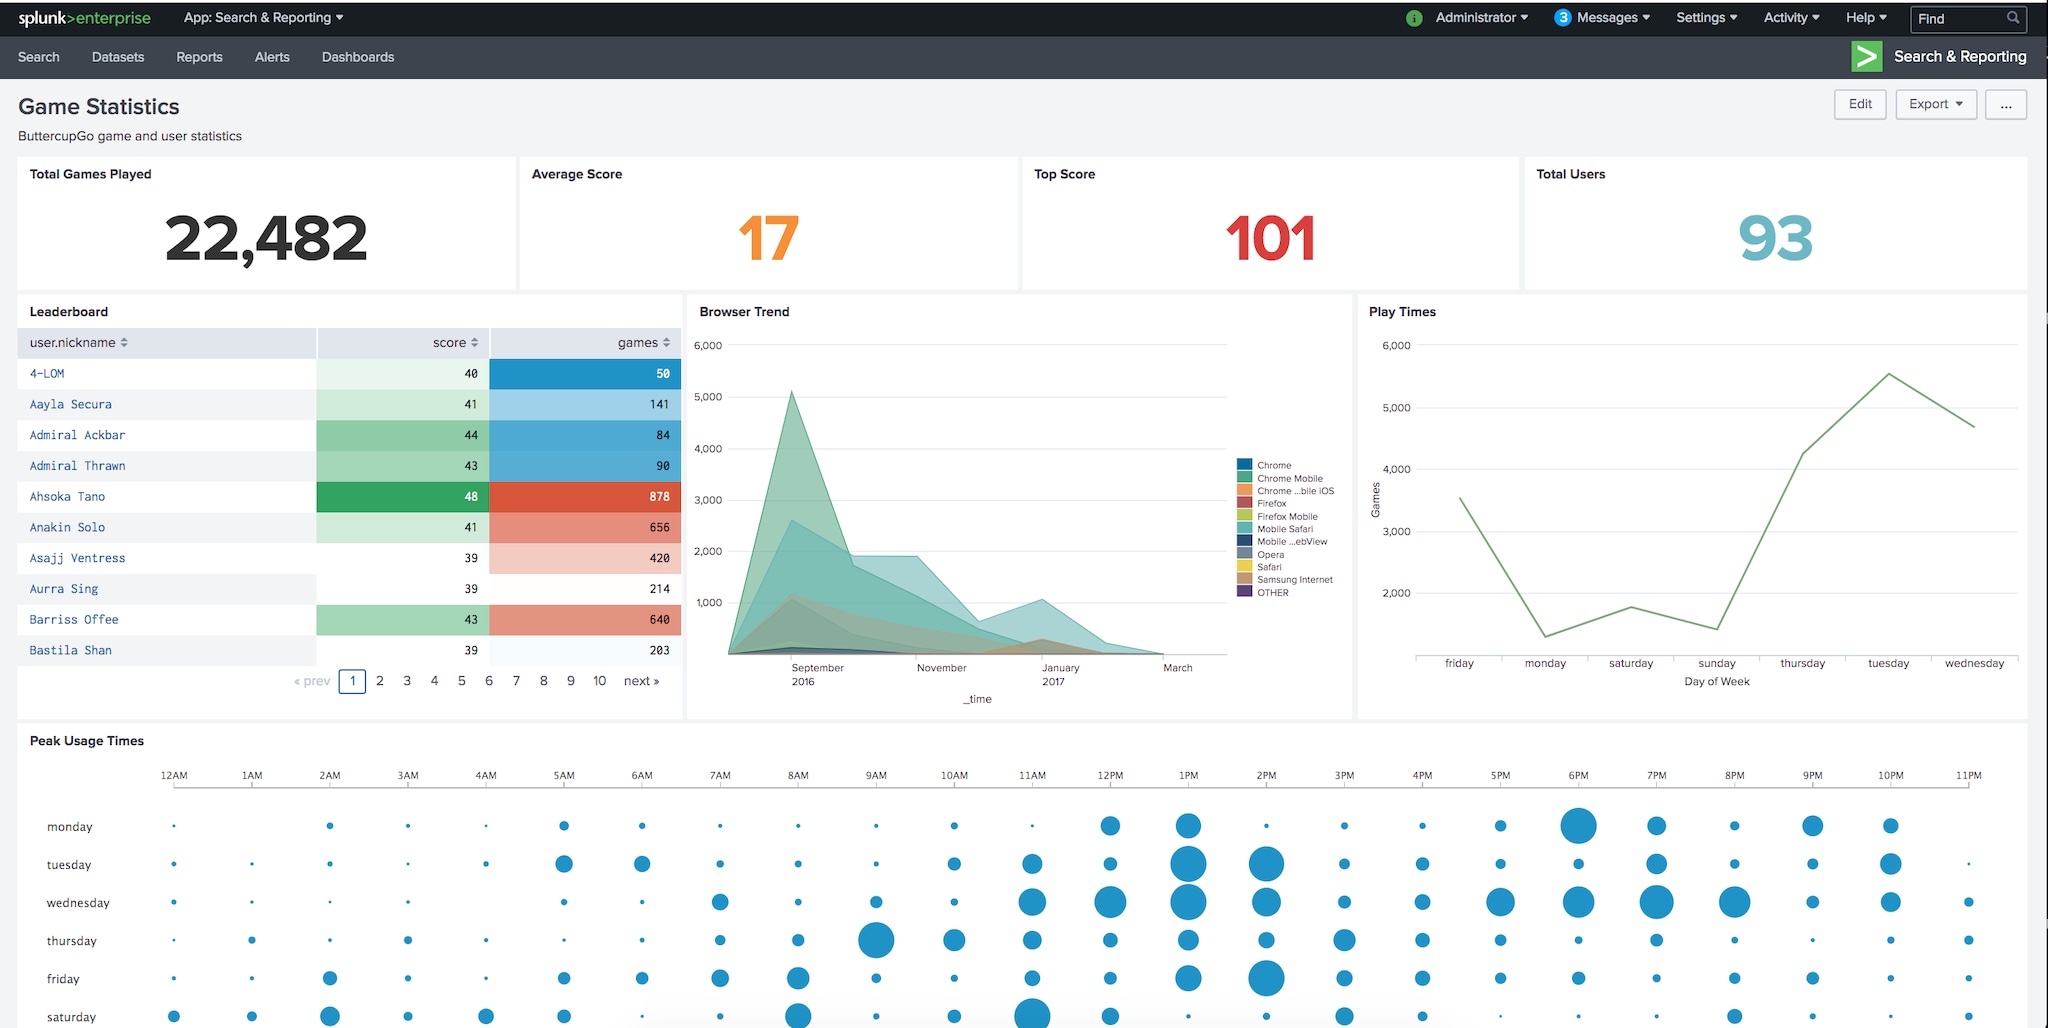
So why would you want a SIEM platform? Its simple really, every product produces logs and those logs are rich in data for diagnosing ongoing application issues or for security incidents amongst other use cases. Typically, products such as of these need significant time and effort to firstly onboard the data from your various servers, containers, etc and then further time ‘normalising’ that data to produce useful dashboard and alerts. For that reason, there are a lot of third party consultancies or managed services available to assist in their set up or for ongoing management.
Recently some of the bigger names in this arena have built automation on top of their platform, allowed customers to automate responses to alerts, such as restarting services, rebooting equipment, or running scripts. Splunk Phantom and Logrhythm SOAR are great examples of these.
There are challenges with the paid solutions, particularly around the pricing models. You often see the pricing based on the amount of data ingested / processed. This can hamstring the use of the product considerably, as many as weary of overage costs, or unsure on how to calculate data usage on a per user-case basis. Thankfully, recently we’ve started to see ‘unlimited’ usage licensing, which is very welcome.
Paid:
- Splunk
- Logrhythm
- IBM QRadar
Open Source:
- ELK
- Alienvault OSSIM
User Experience
User experience monitoring was an area I’d not come across until a few months ago when I started looking at monitoring in the modern day. Its probably because my roles have never focused solely on hosting websites, and my involvement with devs have been limited (not on purpose I promise, you guys and gals are lovely, I’m sure!). But essentially, user experience monitoring (sometimes referred to as digital experience monitoring) is the term used to describe mapping a user’s interactions or experience with your product from the moment they begin using it.
So for example, if I was someone like Amazon. Then from the moment you click or press enter to hit my site, I will be monitoring your interactions, from clicks, to searches, to ‘basket’ performance, right the way through to payment. There are a few reason’s I’d want to do this. Firstly, is my infrastructure working correctly, message queues, search facilities, database queries, etc. But secondly, and this is more interesting is tying these ‘experiences’ with your business. For example, why have 1000 unique users viewed this item, but only 10 people have bought it? What are the most common product searches? What is the impact on my business if the pages take 50% longer to load? When the payment provider went down, how much money did this cost my business? Using user experience monitoring not only ensures your customers are getting the best experience when using your website, but can also help your product teamsunderstand your customers wants and needs.

Paid:
- Pingdom
- New Relic
- Dynatrace
- App-Dynamics
Infrastructure
This is what we all know as ‘traditional’ monitoring, whether that be focusing on network performance or server metrics and has been around for a long while. Products such as PRTG and Solarwinds have had a firm hold of the paid market, whilst Nagios & Zabbix are long-stayers in the free-mium market. Recently we’ve started to see newer products such as ThousandEyes enter the market which, although focused on more network traffic are much more relevant for business using SaaS apps, and workloads in public clouds.
Businesses that utelise only a single cloud providers, such as AWS may be happy with the output from CloudWatch in most cases, as its a more-than-competant infrastructure monitoring tool, however the water muddies somewhat if you’re a multi-cloud customer, trying to get consistency across Azure, AWS & GCP can be a little challenging.
A lot of the long standing Infrastructure vendors are trying to evolve and focus on the APM side of things recently, but that brings about challenges when the structure of your product revolves around monitoring elements or nodes, and not the services that businesses are interested in, and that APM vendors are providing.

Paid:
- Solarwinds
- ThousandEyes
- PRTG
Free:
- Nagios
- Zabbix
APM
Application performance monitoring is a huge buzz word around the monitoring world and is critical to any monitoring stack as it is application aware, which to you and me means that it has the abililty to read all various components that make up an applications. That could be as simple as a back end database and a web tier, or it could include components such as middleware, load balancers, message queues, etc.
By having this kind of visibility, APM is usually able to build up a visual representative of a particular service that could be made up of these varying components. There are a couple of key advantages to this, firstly a quicker mean to resolution on an outage or performance issue. If you know which component is at fault, then you can get the incident to the correct team quicker. Secondly, and I think this is the most important thing, is the service-view of monitoring. I’m a huge advocate to this, for a few reasons. Firstly from a customer point of view, you don’t care if a message queue isn’t working, or a DB query is taking too long, you just know if your application is ‘working’ or not. Secondly, as techies we can sometimes get pigeon-holed into our specialisms, whether that be the storage specialist, the firewall guy, etc. The reality though, is that each team adds something to an application or a service, and ensuring the availability or performance of that is paramount.
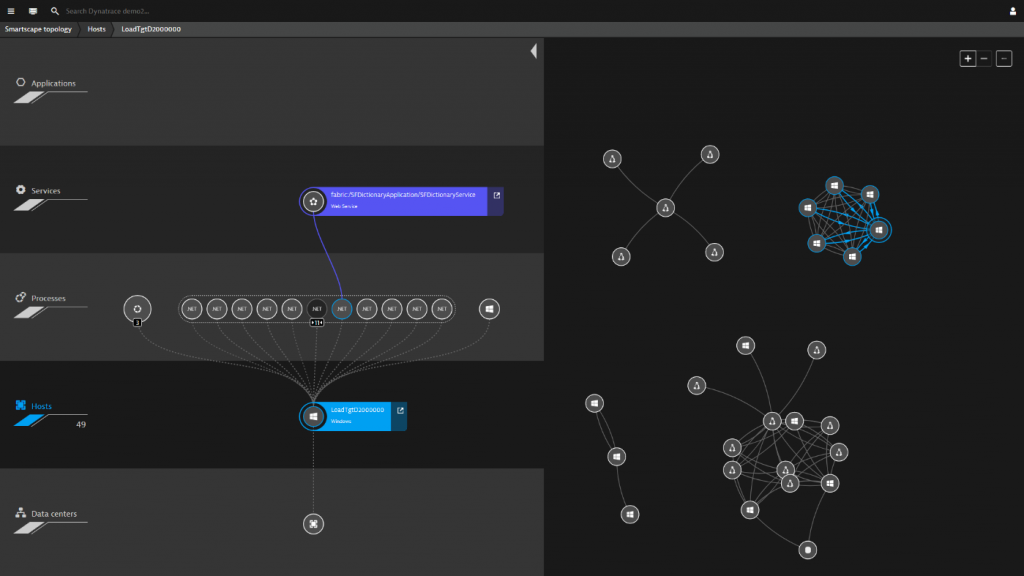
This is a fast-paced area of monitoring at the moment, and I hope to see some of the vendors on the list below being able to provide that end-to-end visibility of all layers of the stack. A lot of these APM vendors, have absolutely nailed the datacenters, and the services that run inside them, its done in a beautifully visual way in a lot of instances, but they are lacking the physical network layer from traditional infrastructure monitoring. For businesses whose monitoring requirements include supporting their internal staff on a private network distributed across multiple sites, understanding any potential issues from their laptop right the way to the application hosted in their chosen private cloud is critical.
Paid:
- Dynatrace
- App-Dynamics
- New Relic
- Datadog
Free:
- Pinpoint
- Apache SkyWalking
I hope this blog post is helpful to someone to understand what the market looks like in 2020. There are plenty of other vendors other than the ones I’ve listed, so if there is anyone I’ve missed off, as always – drop me a message on Twitter or LinkedIn, I’ll happily add you but this isn’t meant as a marketing post, or any free swag – just my view of how to achieve a well-rounded monitoring platform for your business.
Leave a Reply